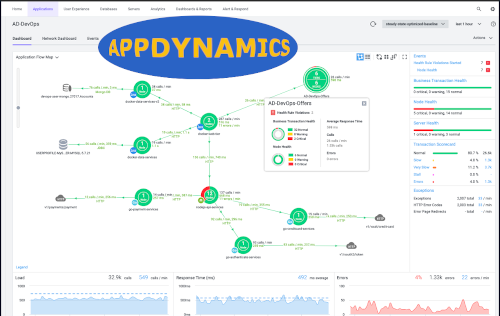
AppDynamics
AppDynamics is an application performance management (APM) tool. This means that it goes quite a bit further than just monitoring memory and CPU usage. It allows you to trace and measure every connection within your application and between applications within your environment.

AppD automatically creates a baseline from captured data to build an understanding of what is ‘normal’. It then automatically detects anomalies. If a given operation takes longer than it normally does, AppDynamics will report this. It also allows you to not only see how long a transaction is but how long each step takes. You can drill down and figure out exactly where an application is slowing down. This makes it easy to find bottlenecks.
For example, lets say you have a web UI. For a given operation, this web UI will first connect to a middleware server which takes a certain amount of time. Then as part of the same transaction the middleware server connects to to a backend database. After this the database returns results to the middleware server which then returns them back to the web UI. This forms one transaction. Each step of this will be measured. So if the initial connection to from the middleware server to the database server takes a large amount of time, you will be able to drill down and identify this.
AppDynamics supports a large number of platforms and technologies. It can trace multiple differnt connection types. This includes calls to a REST API, SOAP calls, database connections, JMS connections, and just about anything else you would find in a large interconnected system.
Competitors
Top competitors or alternatives to AppDynamics:
- Dynatrace
- New Relic
Both of these con be considered basically equivalent but there certain use cases where one tool may be stronger than another.
